A Step-by-Step Guide to Calculating
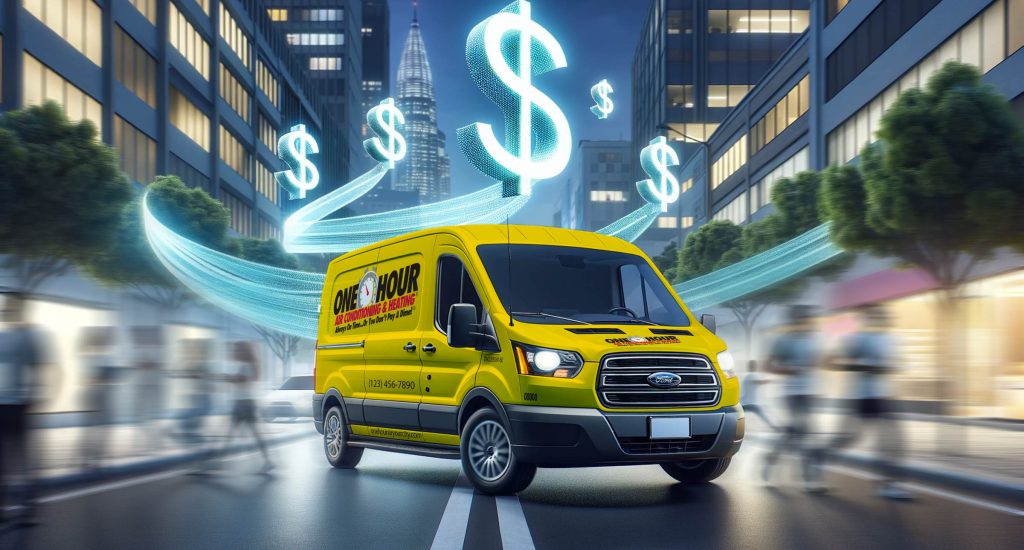
Calculating the return on investment (ROI) for vehicle graphics can be a powerful tool for understanding the effectiveness of your branding efforts.
This comprehensive guide will walk you through each step, from identifying your goals to adjusting your strategy based on the results.
1. Identify Vehicle Graphics Goals
Before diving into the numbers, it’s essential to establish clear goals for your vehicle graphics campaign. Are you aiming to increase brand awareness, generate leads, or drive sales? Defining your objectives will help guide your calculations and ensure you measure the right metrics.
Example Goals:
- Increase brand visibility
- Drive traffic to a website or physical location
- Generate leads through calls or inquiries
- Boost sales for a specific product or service
2. Determine Costs
Next, calculate the total costs associated with your vehicle graphics. This includes the design, production, and installation of the graphics, as well as any maintenance and removal costs.
Cost Components:
- Design costs
- Production costs (materials and printing)
- Installation costs
- Maintenance and touch-up costs
- Removal costs (if applicable)
3. Estimate Potential Impressions
Estimating the potential impressions your vehicle graphics will generate involves considering the vehicle’s exposure to potential customers. Factors such as the geographic area, traffic density, and the duration of the campaign play a crucial role.
Factors to Consider:
- Average daily traffic (ADT) in the areas where the vehicle will be driven
- Number of days the vehicle will be on the road
- Visibility and design appeal of the graphics
Formula:
Total Impressions = ADT x Days on Road x Visibility Factor

4. Calculate Conversion Rate
The conversion rate measures how many of those impressions lead to a desired action, such as a website visit, inquiry, or sale. This step involves tracking and analyzing data to understand the effectiveness of your graphics in prompting customer action.
Methods to Track Conversions:
- Unique URLs or QR codes on the graphics
- Dedicated phone numbers for inquiries
- Surveys asking customers how they heard about you
Formula:
Conversion Rate = (Number of Conversions / Total Impressions) × 100
5. Calculate Revenue Generated
Determine the revenue generated from the conversions. This involves multiplying the number of conversions by the average value per conversion. Depending on your goal, this could be the average sale amount or the value of a lead.
Formula:
Revenue Generated = Number of Conversions × Average Value per Conversion
To calculate the average value per conversion, first sum the total revenue generated from all conversions during your campaign. Then, count the total number of conversions. Finally, divide the total revenue by the number of conversions using the formula: Average Value per Conversion = Total Revenue from Conversions / Total Number of Conversions. This metric helps quantify the financial impact of each conversion, providing valuable insights into the effectiveness of your campaign.
6. Subtract Costs from Revenue
To understand the financial impact, subtract the total costs of the vehicle graphics from the revenue generated. This gives you the net profit attributable to the campaign.
Formula:
Net Profit = Revenue Generated – Total Costs
7. Determine ROI
Calculate the ROI to assess the profitability of your vehicle graphics investment. ROI is expressed as a percentage and shows how much return you received relative to your investment.
Formula:
ROI(%) = (Net Profit / Total Costs) x 100
8. Evaluate the Success of the Campaign
Analyzing the ROI and other performance metrics helps you evaluate the success of your vehicle graphics campaign. High ROI indicates a successful campaign, while a low or negative ROI suggests areas for improvement.
Key Metrics to Evaluate:
- Total impressions
- Conversion rate
- Revenue generated
- ROI percentage
9. Adjust and Optimize Strategy
Based on your evaluation, adjust and optimize your strategy for future campaigns. Consider factors such as design improvements, better-targeted routes, or more effective call-to-action elements on your graphics.
Optimization Tips:
- Refine graphic design for greater impact
- Choose high-traffic routes and strategic parking locations
- Enhance tracking methods for more accurate data
- Experiment with different calls to action and offers
Conclusion
Calculating the ROI of your vehicle graphics is a multi-step process that involves identifying goals, estimating impressions, tracking conversions, and analyzing financial returns. By following these steps and using precise data, you can effectively measure the impact of your campaign and make informed decisions to enhance future efforts. At Signature Graphics, an Omnicom Group agency, we have the expertise and tools to help you maximize your vehicle graphics ROI, ensuring your branding efforts drive measurable success. Contact us today to learn more about our comprehensive services and how we can assist with your next campaign.
FAQs

We proudly use 3MTM graphic films and overlaminates.
